UAE real estate market
KEY INDICATORS OF THE UAE
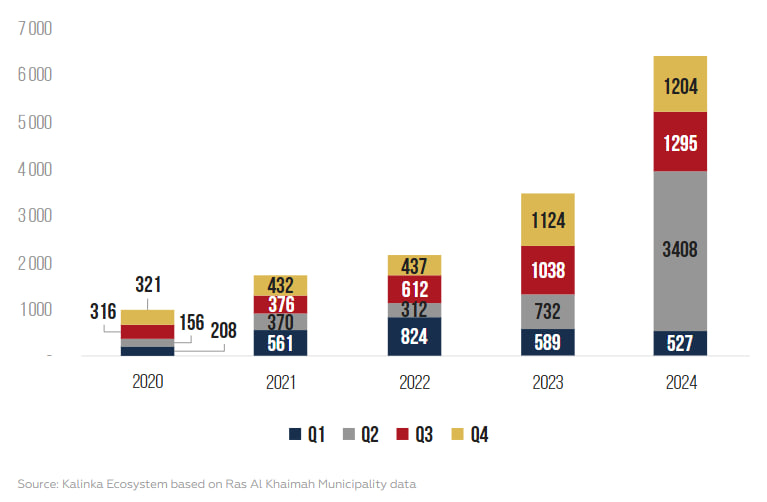
In 2024, Dubai continued to experience growth in demand for residential real estate, with the number of transactions increasing by +38% year-on- year. In contrast, Abu Dhabi saw a decline in demand (-4% year-on-year), while Ras Al Khaimah nearly doubled its sales volume (+85%).
Table. Summary of Demand Indicators in the UAE Real Estate Market

MACROECONOMICS
- The UAE’s GDP growth rate for 2025 is projected to be 2.5%.
- The inflation rate is expected to be 2.8% by the end of 2025.
- The total value of real estate projects planned or under construction is projected to reach $1.8 trillion (+15%).
GDP Growth Dynamics in the UAE and Worldwide

Inflation Rate Dynamics in the UAE and Worldwide

DUBAI RESIDENTIAL REAL ESTATE
- According to Kalinka Ecosystem analysts, in 2024, around 230 new projects were launched in Dubai (including new phases of previously started projects), representing a 15% increase compared to 2023. The leading developer was Emaar (32%).
- The supply volume in Dubai has increased over the past year. According to Kalinka Ecosystem, in 2024, 148,000 new units were announced (+45% compared to 2023).
- Despite the rapid launch of new projects, the actual supply of residential real estate decreased. In 2024, 27,500 new units were delivered, 28% less than in 2023.
- The most attractive projects where sales took place in 2024 in Dubai include: TAG Mansions, Ritz Carlton, Como, Baccarat, Vela, Armani, Orla. Starting purchase budgets – from 3 million AED.
- The average budget per unit in the overall housing market (both primary and secondary) decreased by 7% by the end of 2024 compared to 2023 and amounted to 2.9 million AED. Meanwhile, in the primary market, the figure decreased by 8% compared to 2023, amounting to 2.5 million AED per unit.
- The price per square meter of apartments on the primary market in Dubai as of December 2024 was 18,400 AED (-10% per year), while the unit price of villas and townhouses reached 15,700 AED per square meter (+25% per year).
- In Q4 2024, according to Kalinka Ecosystem and Dubai Land Department data, a total of 47,600 transactions were concluded in Dubai, amounting to 140.2 billion AED. Demand for real estate in the emirate increased by 34% compared to Q4 2023, and the total transaction volume in dirhams exceeded the Q4 2023 figure by 15%.
- By the end of 2024, Dubai set another record in both the number of transactions and transaction volume. According to Kalinka Ecosystem and Dubai Land Department data, a total of 177,200 transactions were concluded, amounting to 513.3 billion AED. Demand for real estate in the emirate grew by 38% compared to 2023, and transaction volume in dirhams increased by 28% compared to 2023.
- By the end of 2024, the share of new builds in demand reached 63%, which is 9 percentage points higher than in 2023 (54%).
Dynamics of the number of units in buildings put into operation and the declared number of units in new projects in Dubai, thousand units

Dynamics of Weighted Average Prices of Lots on the Primary Market (Off-Plan) (AED/sq. m)

KALINKA ECOSYSTEM RESEARCH
- In 2024, the number of primary residential market transactions reached 111,300 units, which is 61% higher than in 2023, while the total transaction volume amounted to 261.1 billion AED, 37% higher than in 2023.
- The primary market (off-plan) demand in 2024 was traditionally dominated by apartments, accounting for 86%, compared to 80% in 2023. In total, 95,500 apartment transactions were concluded in 2024, 74% more than in 2023.
- In 2024, 15,700 transactions were concluded in the villa and townhouse segment, which is 10% more than in 2023. The total transaction volume amounted to 83.9 billion AED (+24% compared to 2023).
- The most sought-after areas for off-plan apartments in 2024 were: Jumeirah Village Circle (+20% compared to 2023), Business Bay (+39%), Dubai Hills Estate (+50%), Mina Rashid (+178%), and Sobha Hartland 2.
- Off-plan villa and townhouse transactions in 2024 were mainly concentrated in the following locations: Al Yur- fah 1 (+59%), Dubai South (+166%), Wada Al Safa 5 (+26%), Dubai Investment Park Second, and Wada Al Safa 7.
Dynamics of Residential Real Estate Transactions in Dubai (units)

Top 5 Areas by Number of Apartment Transactions on the Primary Market in Dubai in 2024 (units)

Top 5 Areas by Number of Villa/Townhouse Transactions on the Primary Market in Dubai in 2024 (units)

ABU DHABI RESIDENTIAL REAL ESTATE
- According to Kalinka Ecosystem analysts, approximately 50 new projects (including new phases in previously launched projects) entered the Abu Dhabi market in 2024. The majority of projects were represented by Aldar Properties (27%). Other active developers included Ohana Development and LEAD Development.
- The most attractive projects launched in 2024 in the emirate include: The Arthouse Saadiyat Grove, Mamsha Palm, Mandarin Oriental (located on Saadiyat Island); Radinat Marina Tower, Rivage (located on Al Reem Island); Yas Riva, Vista Del Mar, Sama Yas, and Gardenia Bay II (located on Yas Island). Starting budgets range from 800,000 AED per lot.
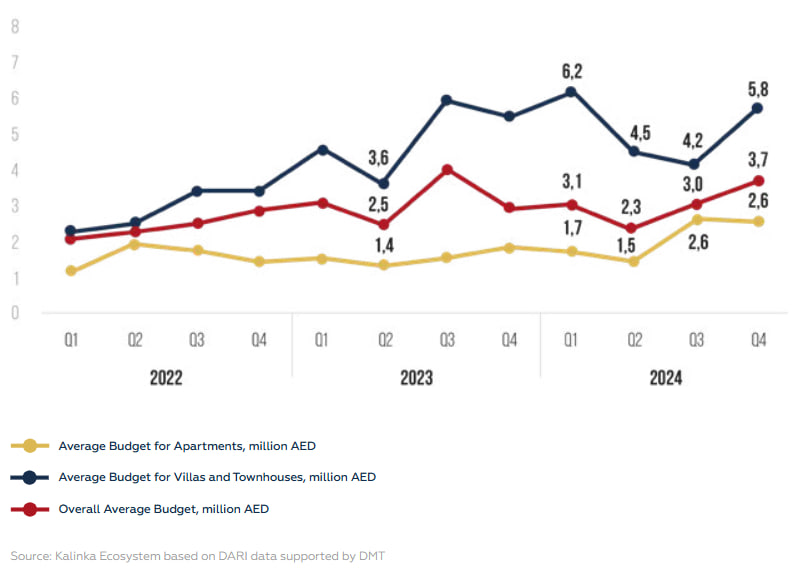
- In 2024, demand for both apartments and villas/townhouses slowed down in Abu Dhabi, while the average lot budget on both primary and secondary markets remained relatively stable:
o The average budget on the primary market in 2024 was 3.6 million AED (+3% year-on-year);
o The average budget for apartments on the primary market in 2024 was 1.9 million AED (+21% year-on-year);
o The average budget for villas, townhouses, and duplexes on the primary market in 2024 was 5.3 million AED (+3% year-on-year). - In Q4 2024, according to Kalinka Ecosystem analysts based on data from the DARI digital ecosystem supported by the Department of Municipalities and Transport (DMT), 3,693 transactions were concluded in Abu Dhabi (+18% quarter-on-quarter and +3% year-on-year).
- The total value of residential real estate transactions in Q4 2024 amounted to 13.5 billion AED (+43% quar-
ter-on-quarter and +28% year-on-year). - Off-plan sales in Q4 2024 accounted for 57% of total sales (compared to 74% in Q4 2023).
Dynamics of Residential Real Estate Transactions in Abu Dhabi (units)

Dynamics of Average Lot Budget on the Primary Market in Abu Dhabi (million AED)
KALINKA ECOSYSTEM RESEARCH
o The total number of off-plan transactions in Q4 2024 was 2,116 lots (+16% quarter-on-quarter and -20% year-on-year). The total value of transactions amounted to 10.2 billion AED (+58% quarter-on-quarter and +20% year-on-year).
o The number of apartment transactions on the primary market in Q4 2024 was 618 lots (-15% quarter-on-quarter and -62% year-on-year), totaling 1.6 billion AED (-16% quarter-on-quarter and -48% year-on-year).
o The number of villa and townhouse transactions on the primary market in Q4 2024 was 1,498 lots (+37% quar- ter-on-quarter and +51% year-on-year), totaling 8.6 billion AED (+88% quarter-on-quarter and +58% year-on-year).
- In 2024, the total number of off-plan transactions (7,902) decreased by 22% compared to 2023 (10,118). The decline in demand is attributed to the limited number of new projects launched in Abu Dhabi in 2024 and the high entry threshold for projects (compared to Dubai), which affects the final investment return.
- The average lot budget across the residential market (primary and secondary) in 2024 was 3.1 million AED, a 4% decrease compared to 2023. However, the average transaction budget on the primary market increased by 3% compared to 2023, reaching 3.6 million AED per lot.
- In 2024, the share of off-plan transactions in demand decreased to 61%, 14 percentage points lower than in 2023.
- In 2024, 7,200 apartment transactions were concluded, a 9% increase compared to 2023. The total transaction volume amounted to 12.3 billion AED (+20% compared to 2023).
- In 2024, 5,700 villa and townhouse transactions were concluded, a 28% decrease compared to 2023. The total transaction volume amounted to 27.5 billion AED (-17% compared to 2023).
- The most sought-after areas for off-plan apartments in 2024 were: Al Reem Island, Yas Island, Al Saadiyat Island, Zayed City, Khalifa City, and Al Jubail Island.
Dynamics of Residential Real Estate Transactions in Abu Dhabi (units)
Apartments

Villas and Townhouses

RAS AL KHAIMAH RESIDENTIAL REAL ESTATE
- In 2024, sales began for approximately 20 new projects in Ras Al Khaimah, including: La Mer, Address Marjan Island, Shoreline, Astera by Aston Martin, Aqua Arc, Cala Del Mar, Granada Villas 2, Manta Bay, and The Ritz-Carlton Residences.
- The average apartment budget in demand in Q4 2024 was 685,000 AED (+3% quarter-on-quarter and +22% year-on-year).
- The average villa budget in demand in Q4 2024 was 2.1 million AED (-4% quarter-on-quarter and +17% year-on-year).
- In Q4 2024, according to Kalinka Ecosystem analysts based on data from the Government of Ras Al Khaimah, 831 real estate transactions were concluded (-4% quarter-on-quarter and +6% year-on-year).
- The total value of real estate transactions in Q4 2024 amounted to 1.2 billion AED (-7% quarter-on-quarter and +8% year-on-year).
- Among freehold transactions in Q4 2024:
o 272 apartment transactions were concluded, totaling 186 million AED (+26% quarter-on-quarter and +8% year-on-year);
o 62 villa transactions were concluded, totaling 132 million AED (-19% quarter-on-quarter and +12% year-on-year). - In 2024, according to Kalinka Ecosystem analysts based on data from the Government of Ras Al Khaimah, 3,159 real estate transactions were concluded in the emirate (+2% compared to 2024).
- The total value of transactions in 2024 amounted to 6.4 billion AED (+85% compared to 2023).
- Among freehold transactions in 2024:
o 1,018 apartment transactions were concluded (-20% year-on-year), totaling 668 million AED (+1% year-on-year);
o 247 villa transactions were concluded (+3% year-on-year), totaling 503 million AED (+17% year-on-year). - The most popular areas in Ras Al Khaimah for real estate buyers were: Al Jazeera Al Hamra, Al Marjan, and Hayat Island.
Dynamics of Real Estate Transactions in Ras Al Khaimah (units)

Dynamics of Real Estate Transaction Volume in Ras Al Khaimah (million AED)
SHARJAH REAL ESTATE MARKET
Key Statistics for Sharjah in 2024:
• Sales volume in Sharjah: 40 billion AED (+48% compared to 2023);
• Number of transactions: 45,676 (+46% compared to 2023);
• Number of nationalities involved in Sharjah transactions: 120 (compared to 103 in 2023).
Emirati Investments:
• Total investment volume: 19.2 billion AED (48% of total investments).
GCC Investments:
• Total investment volume: 2.3 billion AED (5.7% of total investments).
Arab Investments:
• Total investment volume: 7 billion AED (17.5% of total investments).
International Investments:
• Total investment volume: 11.5 billion AED (28.8% of total investments).
Top 5 Buyers of Sharjah Real Estate in 2024 by Country:
• India (2,698 transactions);
• Syria (1,761 transactions);
• Iraq (1,012 transactions);
• Egypt (957 transactions);
• Pakistan (865 transactions).
Key Locations for Real Estate Purchases in Sharjah:
• Muwailih Commercial;
• Umm Fanain;
• Al-Khan;
• Tilal;
• Al-Qasimia City.
Dynamics of Real Estate Transactions in Sharjah in 2024

Number of Real Estate Transactions in Sharjah with Foreign Buyers in 2024

Similar articles


Broker help
We will help you find, buy or sell luxury real estate