The secondary market of elite residential real estate in Moscow
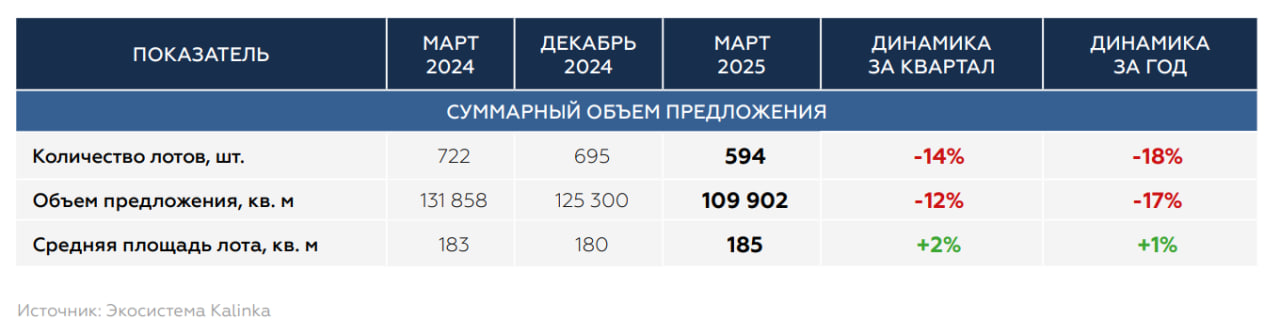
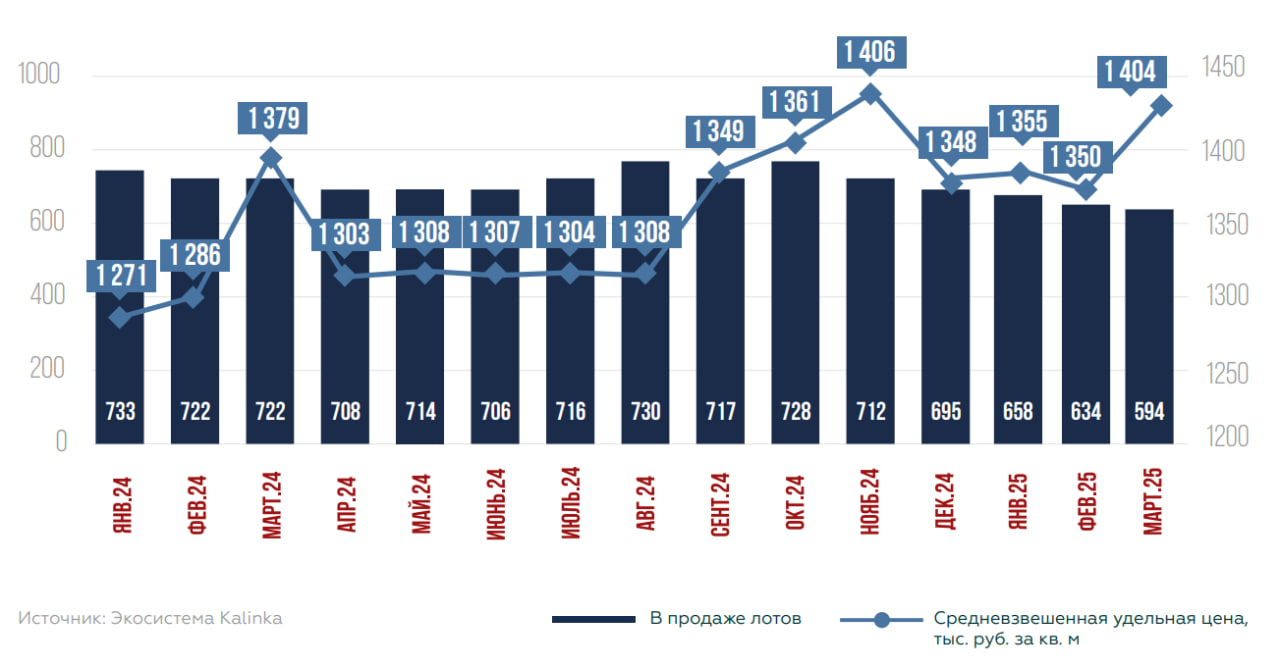
By the end of March 2025, 594 lots totaling 109.9 thousand square meters were on display in the secondary market of high-budget real estate in Moscow.
Compared to December 2024, the number of lots on display decreased by 14%. During the year, the number of lots on sale decreased by 18%, the volume of supply decreased by 17%.
The average area of the lot on display in March 2025 was 185 square meters, which is 1% more than in the same period of 2024.
Table. Summary indicators of the exhibited offer in the secondary market of luxury housing in Moscow
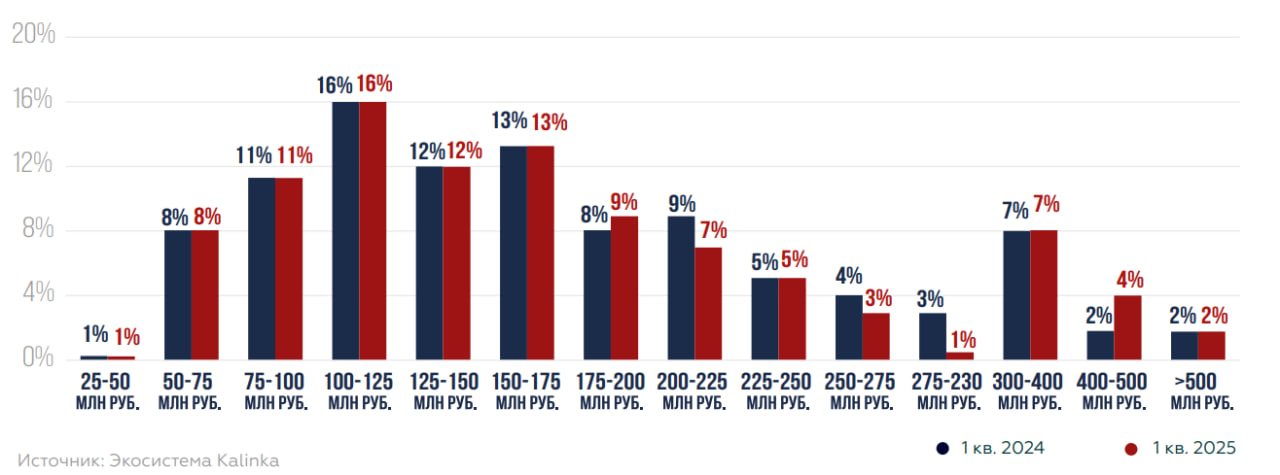
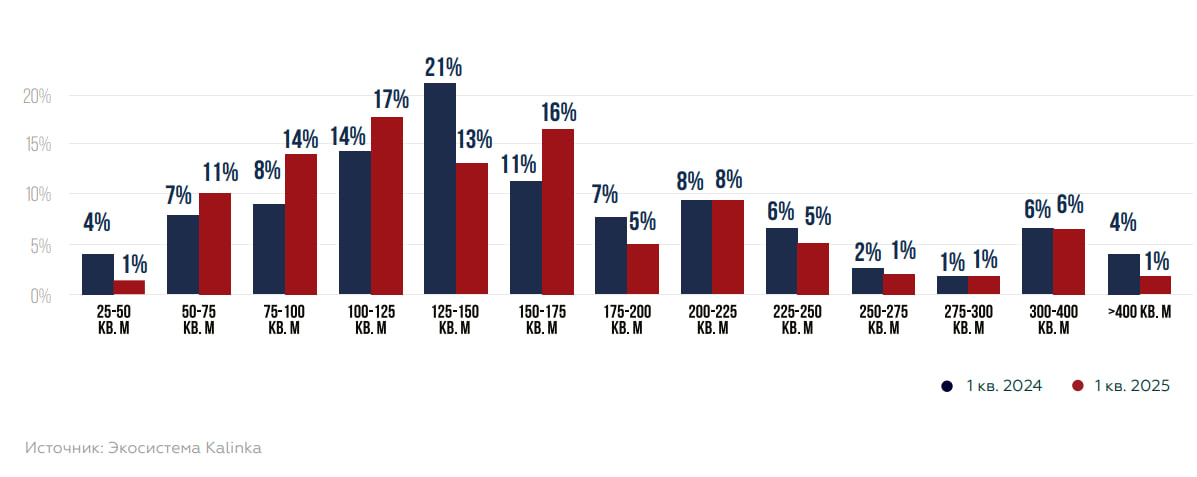
The graph below shows a comparison of the percentage distribution of luxury apartments and apartments for sale by their area at the end of March 2024 and 2025. The change in the area supply structure over the year is generally insignificant, most ranges have retained their shares. The largest share of the supply in both periods is for lots with an area of 100-125 square meters (16%).
A noticeable increase in the share was recorded in the segment of 400-500 square meters (from 2% to 4%), as well as a slight increase in the range of 150-175 square meters (from 8% to 9%). At the same time, there is a decrease in the share of supply in the ranges of 175-200 square meters (from 9% to 7%) and especially 275-300 square meters (from 3% to 1%).
Chart. Comparison of the distribution of luxury apartments/apartments on display by area at the end of March 2024-2025, %
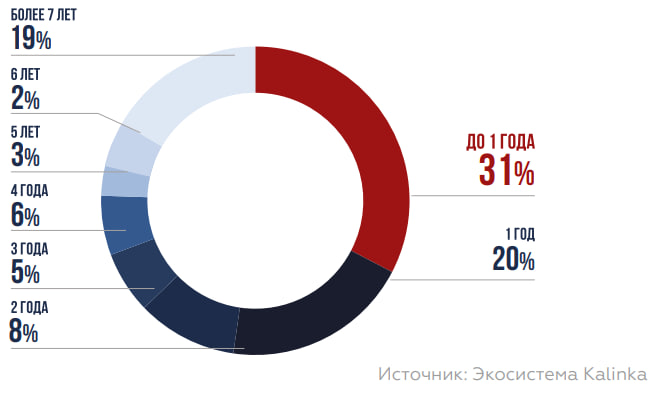
Compared to March 2024, the structure of the offer for the exhibition period at the end of March 2025 has changed: the share of lots that have been on sale for exactly 1 year has increased significantly (from 14% to 20%, +6 percentage points), and the share of the “oldest” objects with an exhibition period of more than 7 years has increased (from 17% to 19%, +2 p.p.). At the same time, there was a reduction in the shares of lots with terms of 2 years (from 10% to 8%, -2 p.p.) and especially 3 years (from 8% to 5%, -3 p.p.), which indicates a redistribution of supply towards both relative recent (1 year) and very long-term sales.
Chart. Distribution of the offer by exposure date at the end of March 2025, %
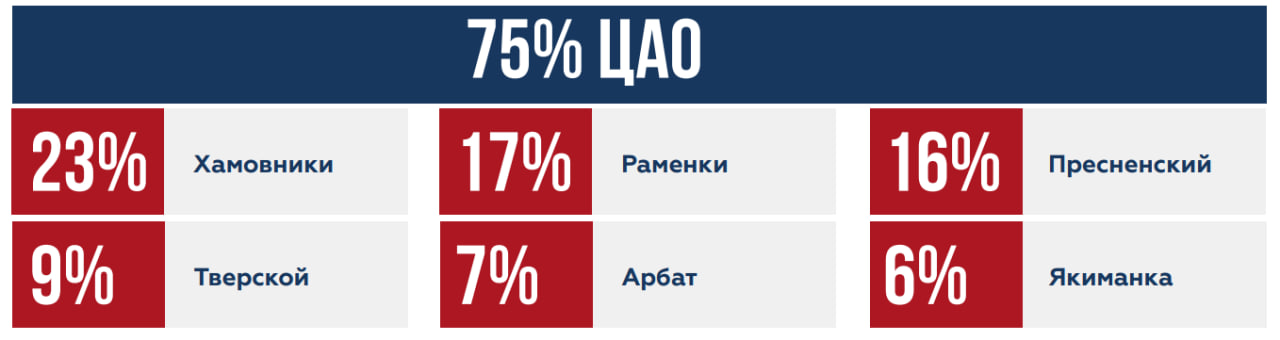
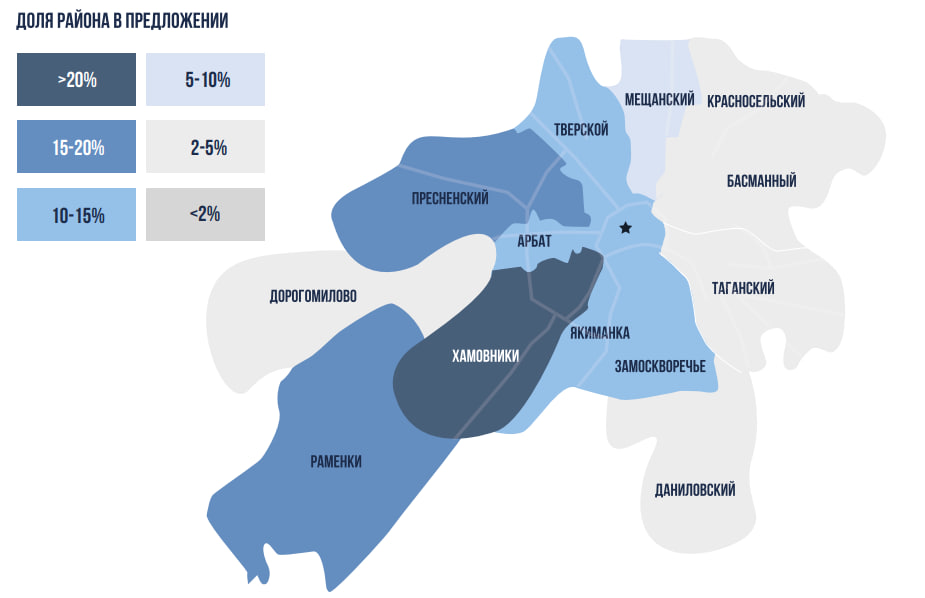
The secondary market of luxury real estate has the largest share of supply in sq.m. m is concentrated in the Central Administrative District, which accounted for about 75% at the end of March 2025. The distribution of elite supply in the secondary housing market by district is as follows: the leader in terms of supply per square meter is traditionally the Khamovniki district, whose share at the end of March 2025 was 23% (-2 percentage points by December 2024). Ramenka district is in second place with a share of 17% (+1 percentage point by December 2024). This is followed by Presnensky district, which accounted for 16% (-3 percentage points by December 2024). In total, the top 3 districts include 56% of the total supply. Tverskoy (9%), Arbat (7%), Yakimanka (6%) and Zamoskvorechye (5%) districts also account for a significant share of the supply.
Price situation
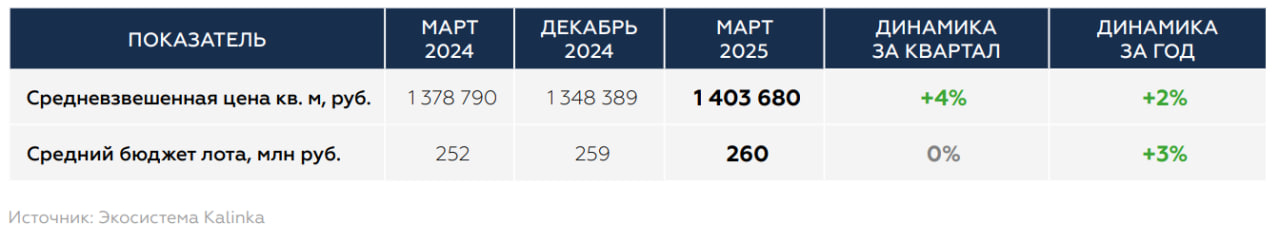
According to the results of March 2025, in the secondary luxury real estate market in Moscow, the weighted average offer price was 1,404 thousand rubles / sq. m (+4% for the quarter and +2% for the year). The indicator of the weighted average supply price continues to be influenced by the macroeconomic situation, as well as changes in the supply environment due to the leaching of more liquid lots and a reduction in the total supply.
Table. Summary price indicators of supply in the secondary market of luxury housing in Moscow
The share of lots that are displayed in foreign currency at the end of March 2025 was 18%, which is 1 percentage point less than at the end of December 2024 and 4 percentage points less than at the end of March 2024. In absolute terms, the number of lots in foreign currency decreased by 18% compared to December 2024 and decreased by 30% compared to March 2024. Most of the lots in Moscow's secondary luxury housing market (314 units) are new and went on sale between March 2024 and March 2025 (53% share in the total volume). For 97% of the lots that were sold at the end of March 2025, the display currency has not changed. The change in currency affected only 3% of the lots in the offer, of which 2% of the prices of apartments/apartments were converted into rubles, and 1% of the lots were converted into dollars and euros.
Chart. The dynamics of supply (units) and the weighted average unit price (thousand rubles/sq. m.) in the secondary market of Moscow at the end of MARCH 2025
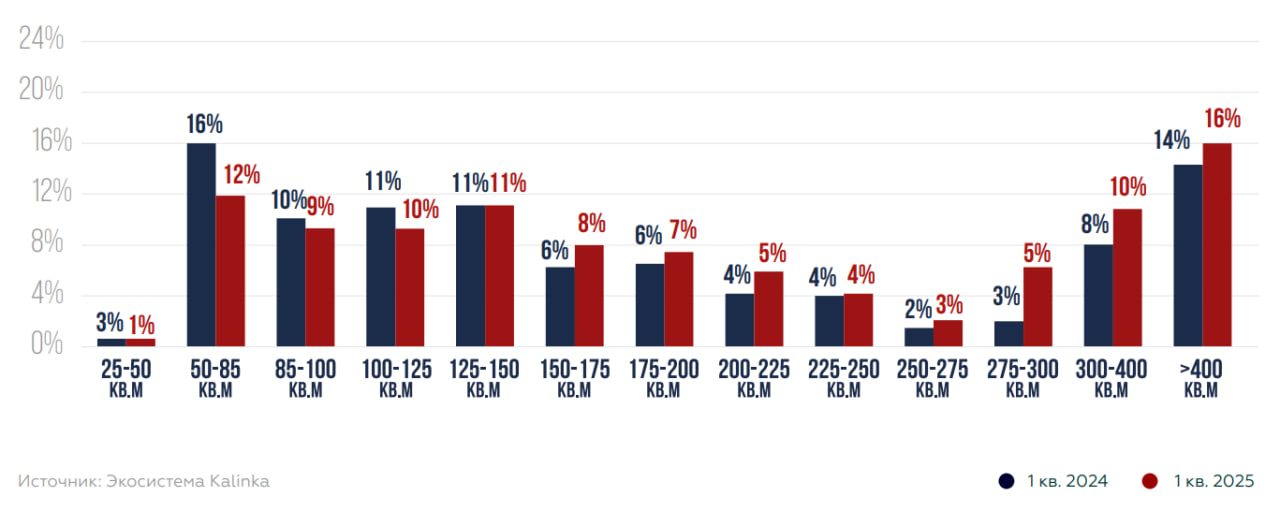
Of the total pool of objects (594 units), the owners of 23% of the lots in the offer, which were on display at the end of March 2025 on the secondary market of luxury real estate in Moscow, have not changed the sale prices. For lots that are displayed in rubles, the average price change was +8% per year. For lots priced in a foreign currency, the average price change was -7%, including due to a decrease in the exchange rate at the end of March 2025 compared to the end of March 2024. By the end of March 2025, the average lot budget for sale on the secondary luxury real estate market in Moscow had not changed over the quarter and amounted to 260 million rubles, which is 3% more than at the end of March 2024. The largest share is accounted for by lots that are offered in the budget of over 400 million rubles. Over the year, the share in this segment increased by 2 percentage points and reached 16%. In addition, there is an increase in the share of lots in the offer by 2 percentage points in the ranges of 150-175 (+2 percentage points), 275-300 (+2 percentage points), 300-400 (+2 percentage points) and more than 400 (+2 percentage points).
Chart. Lot price changes in March 2025 to March 2024
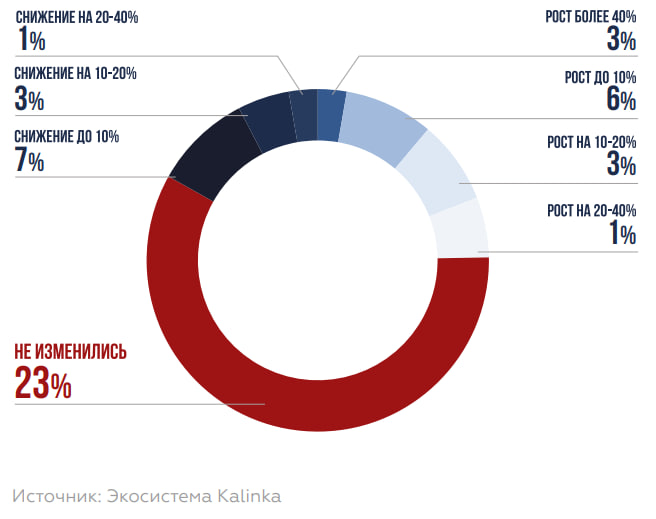
Chart. Comparison of the distribution of exhibited apartments/apartments by the value of lots at the end of March 2024 and at the end of March 2025, %
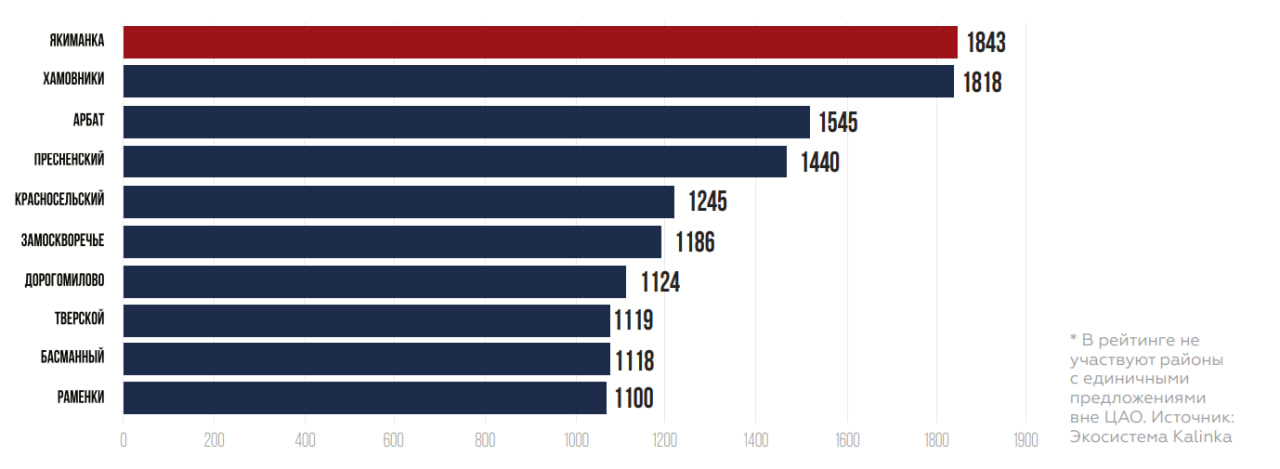
Yakimanka district is the leader among Moscow's districts in the secondary luxury real estate market at the weighted average offer price at the end of March 2025. The weighted average cost of secondary residential real estate in this area of Moscow remained virtually unchanged over the quarter and amounted to 1,843 thousand rubles / sq. m, which is 1% higher compared to the end of March 2024. Khamovniki district is in second place: 1,818 thousand rubles / sq. m (-1% by December 2024 and +7% by March 2024). Arbat district closes the top three: 1,545 thousand rubles / sq. m. m (0% by December 2024 and +21% by March 2024) due to the leaching of the most liquid supply in the location.
Chart. Rating of districts according to the weighted average unit cost of supply on the secondary market, thousand rubles per sq.m. m at the end of MARCH 2025*
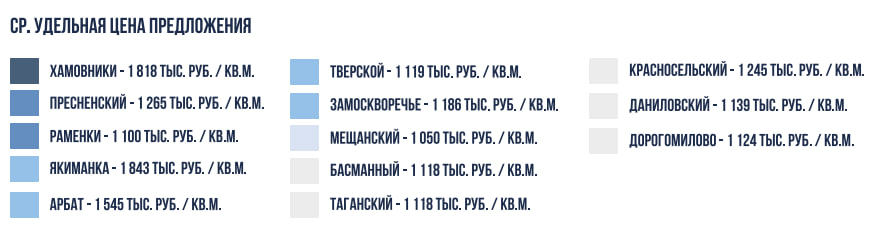
Map. Distribution of the elite offer in the secondary market and weighted average prices of exhibits by region at the end of March 2025
Demand
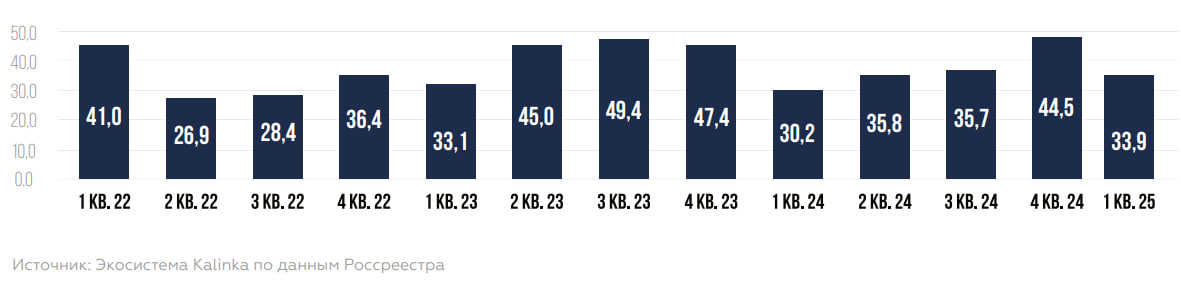
In Q1 2025, the Federal Register of Moscow recorded 33.9 thousand transfers of rights on the secondary market, which is an increase of 12% compared to Q1 2024 (30.2 thousand transactions), due to a combination of economic, behavioral and market factors. When it became clear that the bid remained high, some buyers decided to "not wait any longer."
Chart. Quarterly dynamics of demand in the secondary housing market in Moscow as a whole, thousand units, 1q. 2022 – 1q. 2025
According to the Kalinka ecosystem, demand in the secondary market of high-budget real estate for Q1 2025 showed an increase of +35% compared to Q1 2024. Macroeconomic and behavioral factors had a complex impact, increasing interest in luxury real estate as a tool for preserving and increasing capital. The average area of a sought-after lot in the secondary market of high-budget real estate in Moscow in Q1 2025 was 157 square meters, which is 7% less than in Q1 2024 (169 square meters).
- 165 sq. m. 103 sq. m. The average area of a sought-after apartment in 1 sq. m. 2025 (-7% per year)
- The average area of a sought-after apartment in 1 sq.m. 2025 (-23% per year)
In the demand structure, 43% of the lots from the total demand for Q1 2025 were on display for less than 1 year, 21% of the lots were on sale for about 1 year, and 36% of the lots sold for 2 years or more. The average exposure period for purchased lots in Q1 2025 was 2 years, which is 0.4 years lower than the average exposure period for demanded lots in Q1 2024.
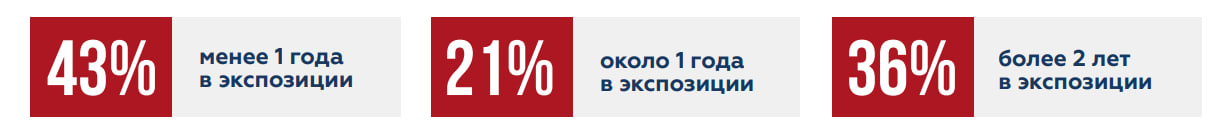
Chart. Distribution of realized lots by exposure period in %, 1Q 2025
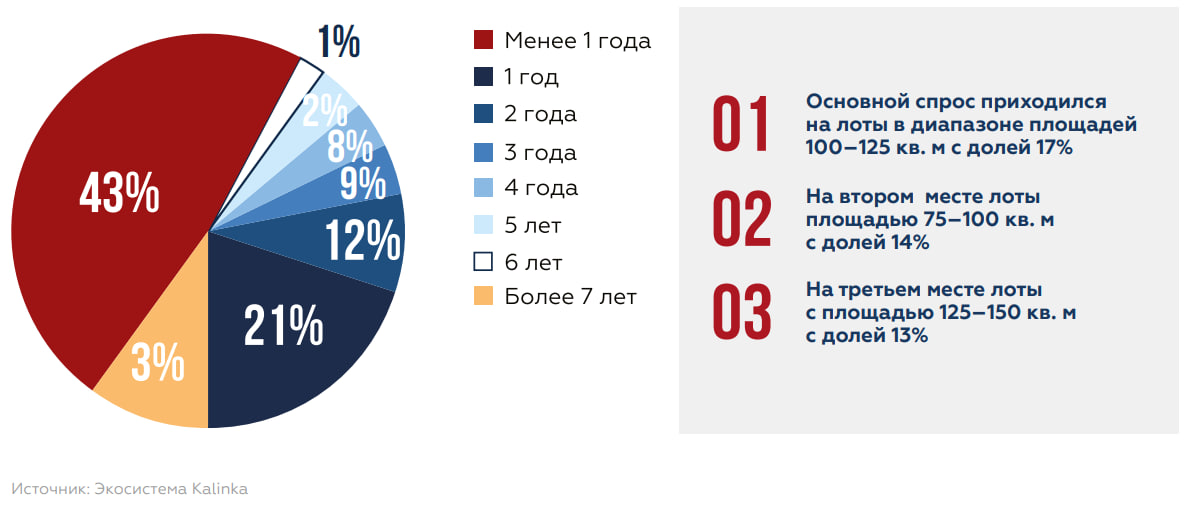
The ranges of demanded lots for Q1 2025 were distributed as follows: the main demand was for lots in the area range of 100-125 square meters. m with a share of 17% (+3 percentage points for the year). In second place are lots with an area of 150-175 square meters. m with a share of 16% (+5 percentage points compared to last year). In third place are lots with an area of 75-100 sq. m. m with a share of 14% (+6 percentage points compared to last year). For Q1 2025, the largest volume of demand in the quarter is Demand for secondary luxury housing was recorded in the Khamovniki district, which accounted for 30% (+3 percentage points compared to Q1 2024). In second place is Presnensky district, whose share in demand was 13% (-4 percentage points compared to Q1 2024). In third place is Yakimanka district with a share in demand of 9% (+3 percentage points compared to Q1 2024).
Chart. The rating of the TOP 10 districts in terms of demand in the quarter m in the secondary luxury housing market for Q1 2025, % of total demand for the period
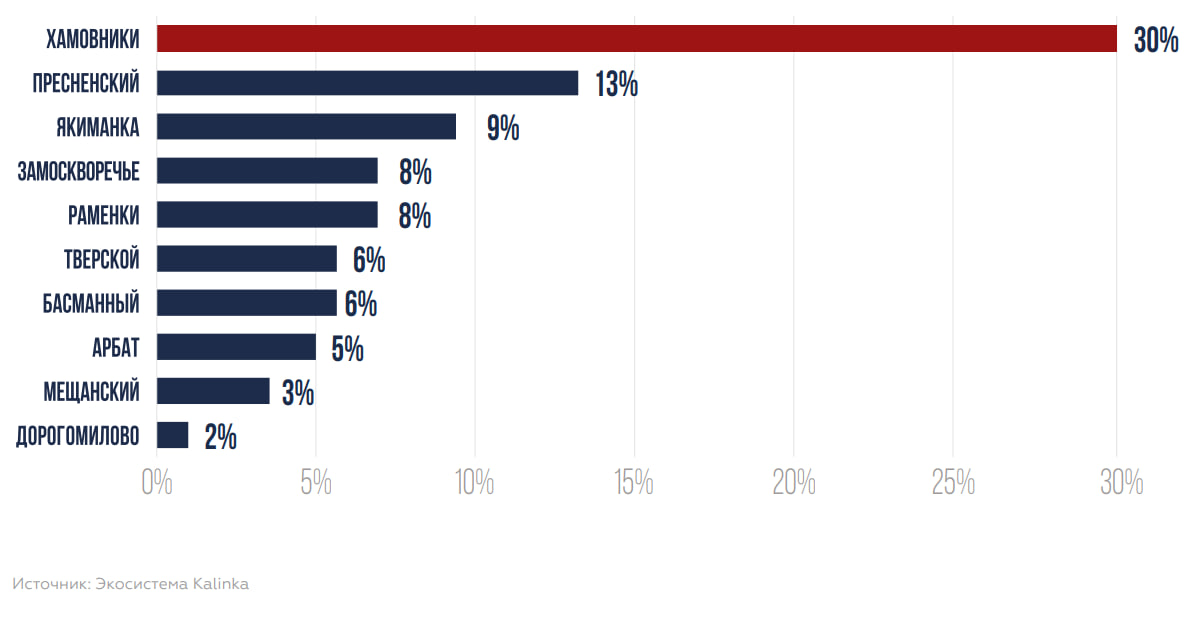
Chart. Comparison of the distribution of demand in the secondary luxury housing market for Q1 2024 and Q1 2025 by area, %
The average value of the purchased lot for Q1 2025 was 176.1 million rubles, which is 20% higher than in Q1 2024 (147 million rubles). For apartments, the figure was 181.7 million rubles (+20% per year), for apartments – 135.8 million rubles (+20% per year).
The distribution of demand according to the purchase budget for Q1 2025 was carried out as follows: the largest number of transactions fell in the range of 50-85 million rubles with a share of 20% (-1 percentage point dynamics for the year). In second place is the range of 100-125 million rubles with an indicator of 14% (+6 percentage points by Q1 2024). Next is the range of 150-175 million rubles with a demand share of 12% (+5 percentage points by Q1 2024).
Chart. Comparison of the distribution of demand in the luxury market for Q1 2024 and Q1 2025 by budget, %
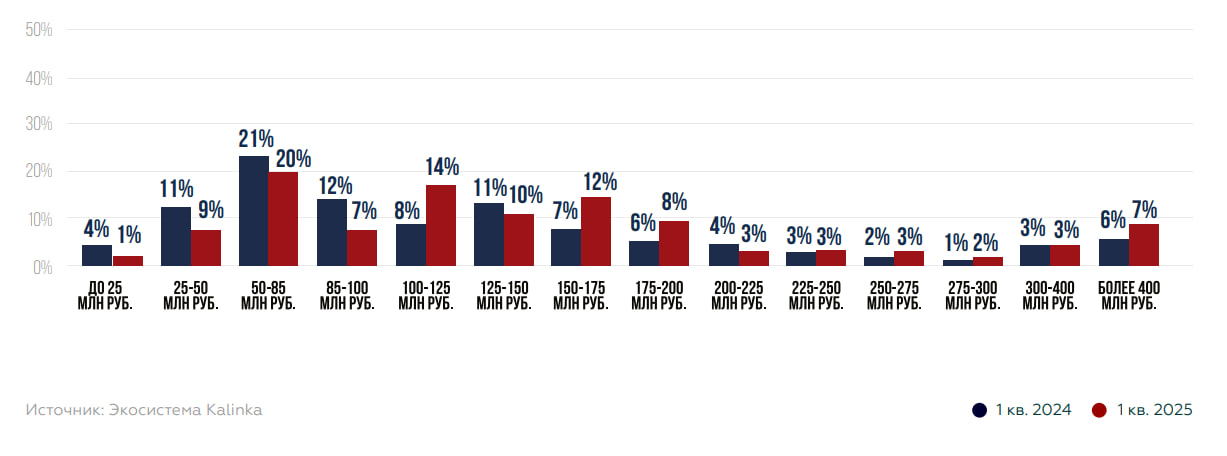
Table. Distribution of the elite supply in the secondary market by area and cost at the end of March 2025, %
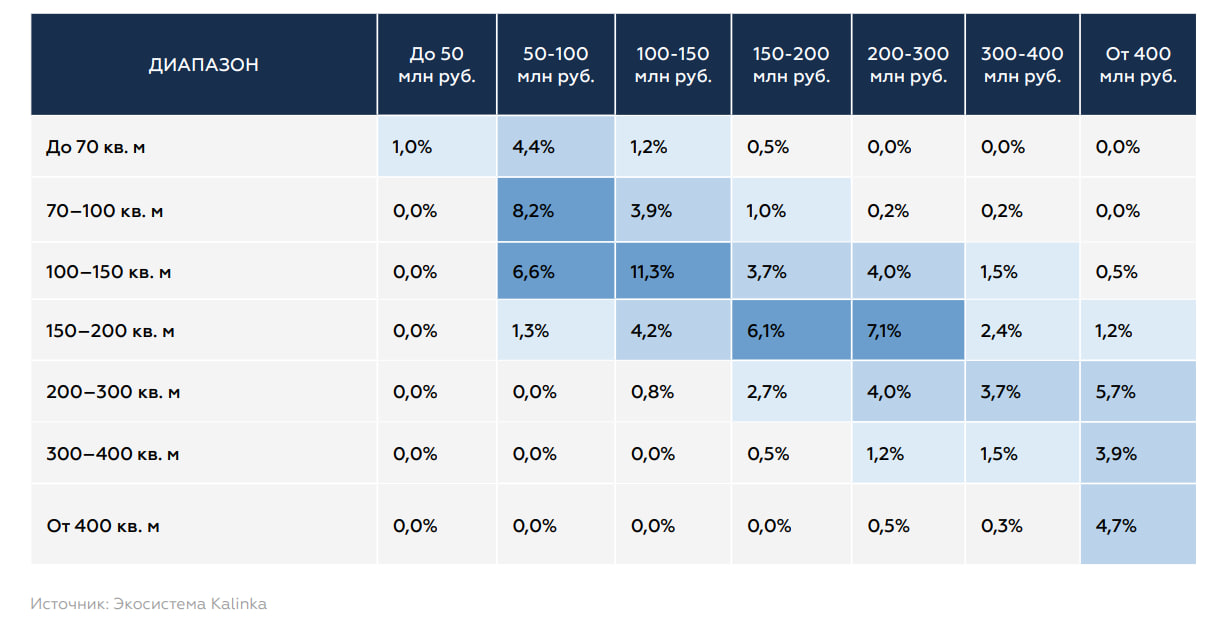
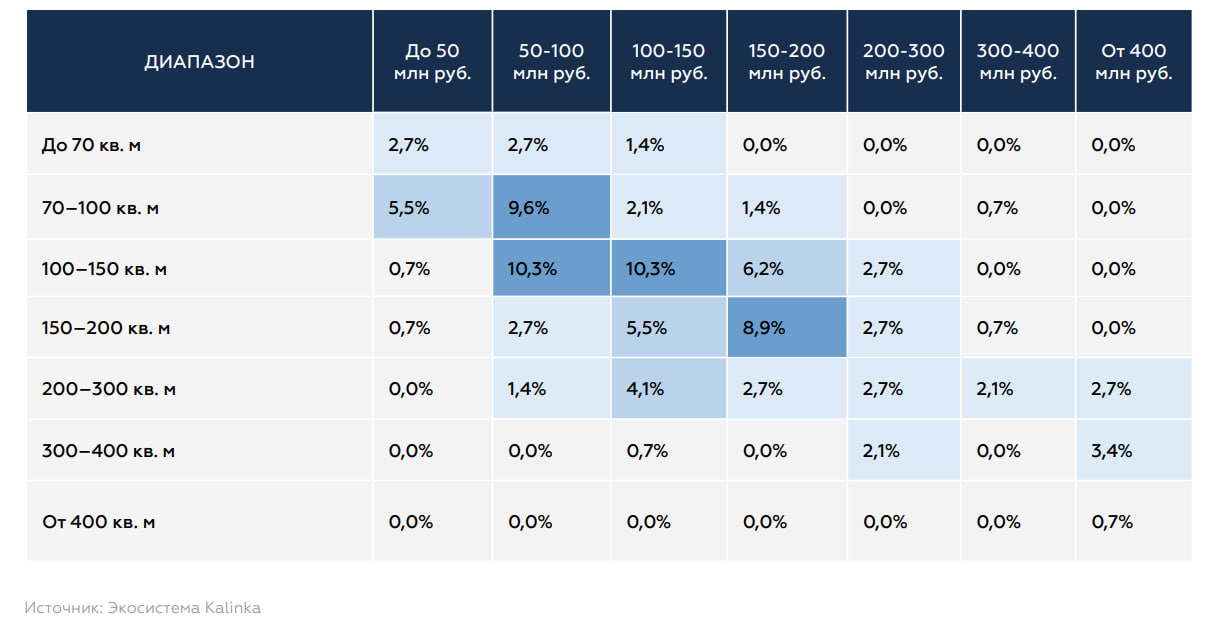
Table. Distribution of demand in the secondary luxury real estate market by area and value at the end of March 2025, %
Similar articles


Broker help
We will help you find, buy or sell luxury real estate