Moscow's primary luxury real estate market
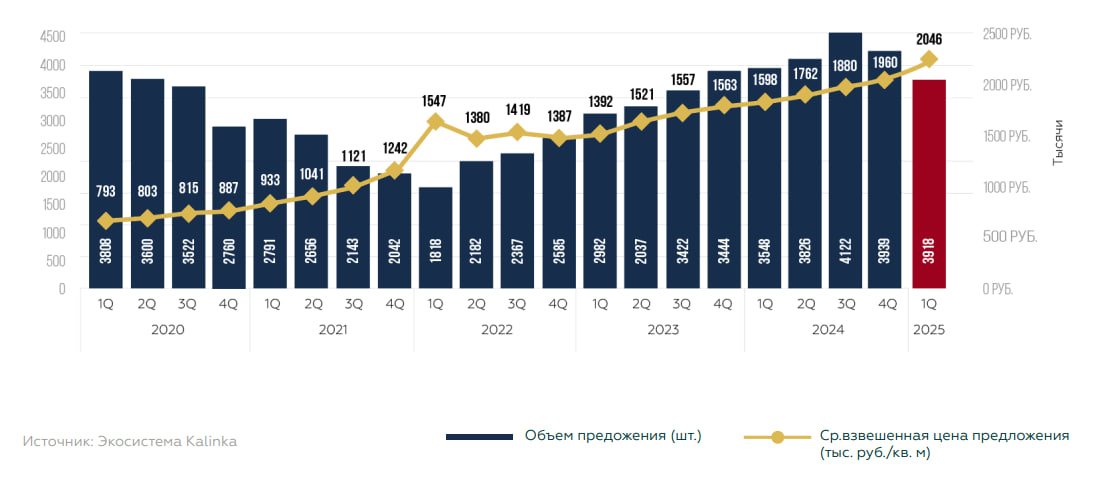
According to the results of the 1st quarter of 2025, the total number of offers on the luxury new building market amounted to 3,918 apartments and apartments, which is 10% more than in the 1st quarter of 2024, but compared to the results of 2024, there was a decrease of 1%. The total supply of deluxe and premium class real estate amounted to 572 thousand square meters (+19% per year). The volume of the offer as a whole remains at a high level due to the high proportion of the deluxe class.
In the elite market as a whole, the share of the deluxe class in the total supply increased from 37% in the 1st quarter of 2025. In the 1st quarter of 2025, customer activity showed a high level relative to the indicators at the beginning of the previous year. Nevertheless, the developers' plans to bring new projects to the market were adjusted against the background of maintaining a high key rate (21%) and expensive project financing. As a result, not a single project went on public sale during the quarter. in the first quarter of 2024, up to 45% by the end of the 1st quarter of 2025 - up to 258 thousand square meters (+44% for the year).
In subclass Urga B sell 2,564 lots (0% per year and -1% per quarter) on 313 t of Urga. KV. M (+4% per year and -4% per quarter).
In the 1st quarter of 2025, closed sales of only 3 new deluxe club projects started in the primary luxury real estate market in Moscow. The total supply of new projects amounted to 42 lots for 12.5 thousand square meters (-92% compared to the 1st quarter of 2024). At the same time, against the background of high demand, developers are still interested in launching new projects and it is planned to actively test new projects in the closed sales format before receiving the project documentation.
According to the results of the 1st quarter, 104 residential and apartment complexes were on sale in the primary luxury residential real estate market in Moscow compared to 108 a year earlier. The share of complexes with less than 10 lots on sale decreased from 39% to 37% over the year. In general, about 54% of the lots have already been sold in the projects. Developers continue to withdraw lots for sale in pools, keeping some of the lots in reserve: for example, among the unrealized volume of apartments and apartments, only 45% of the lots are for sale, and 55% are held in reserve by developers.
Table. Summary indicators of the exhibited offer in the primary luxury housing market in Moscow
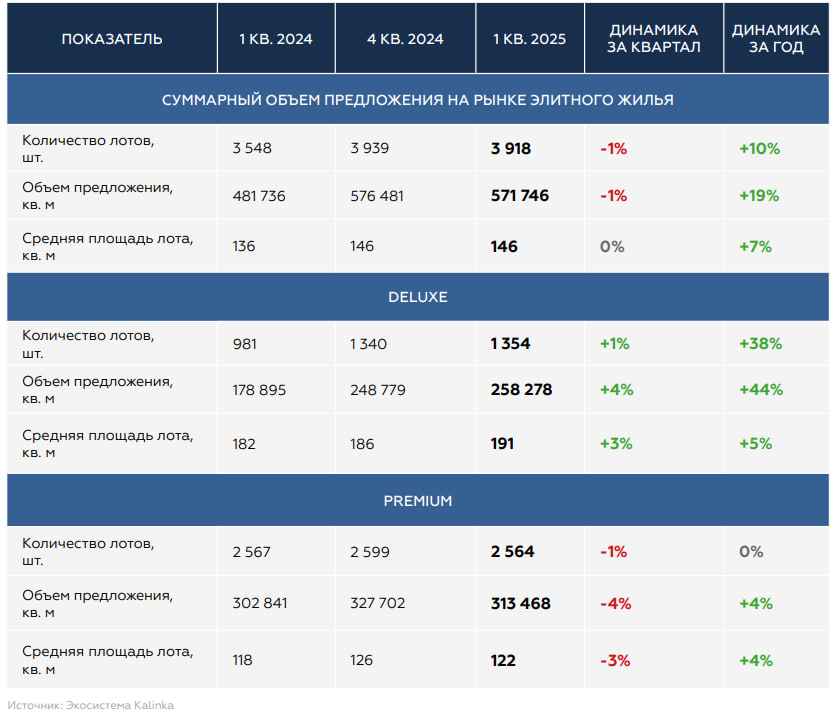
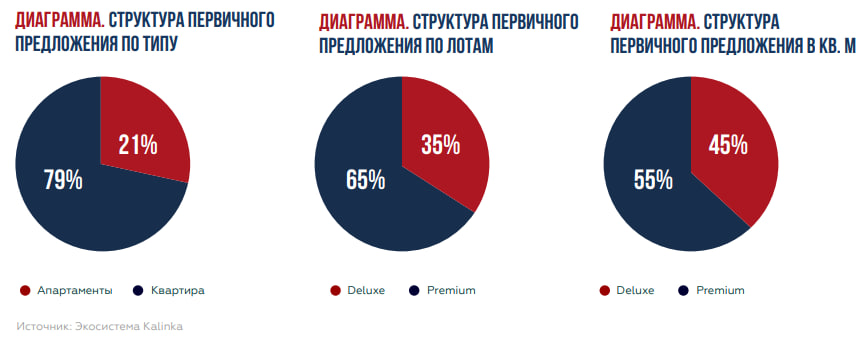
Chart. Dynamics of the total supply volume by class, thousand square meters. m

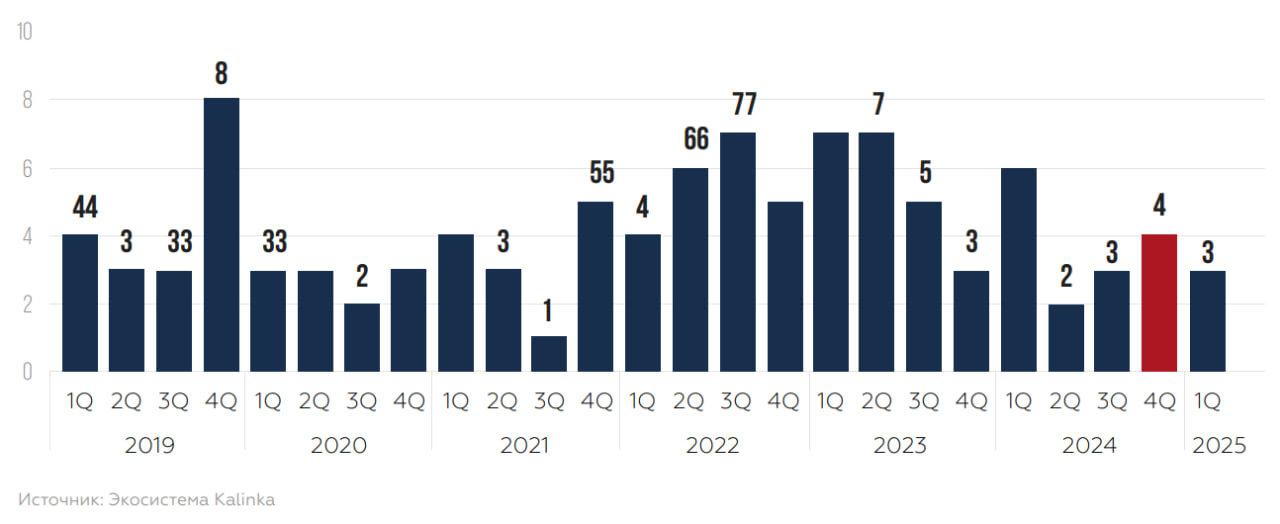
In 2025, the activity of developers in launching new projects is expected to decrease. However, some projects are still planned to be released in the next 1-1.5 years. As a result of the shift in plans for the launch of new projects by the end of 2025, it is planned to launch up to 8-12 new projects.
Table. New supply on the primary luxury housing market in the 1st quarter of 2025
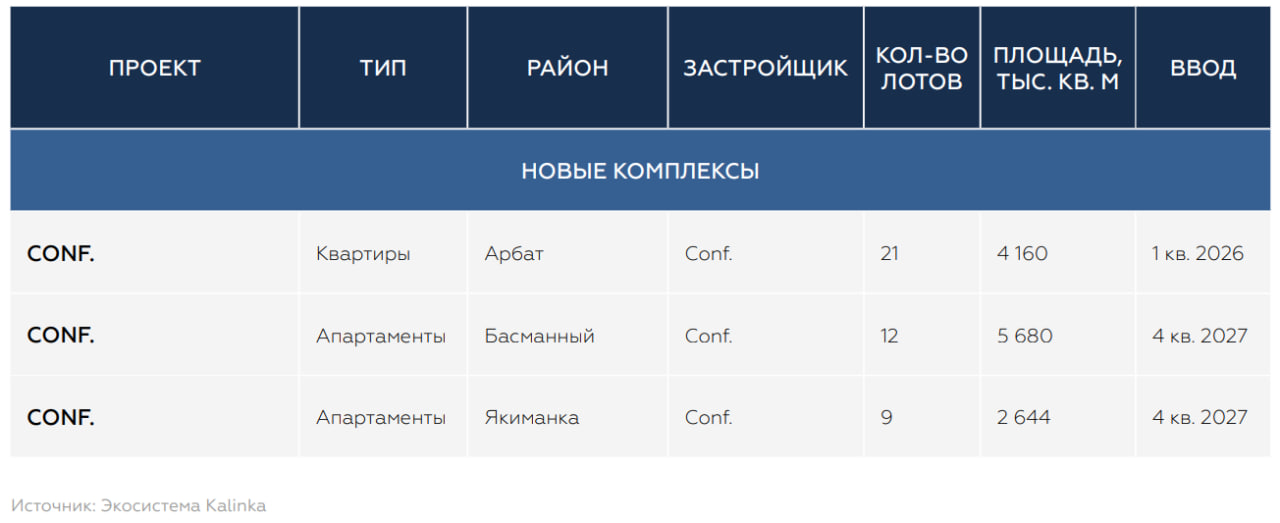
Chart. Dynamics of new elite projects entering the Moscow market, pcs.
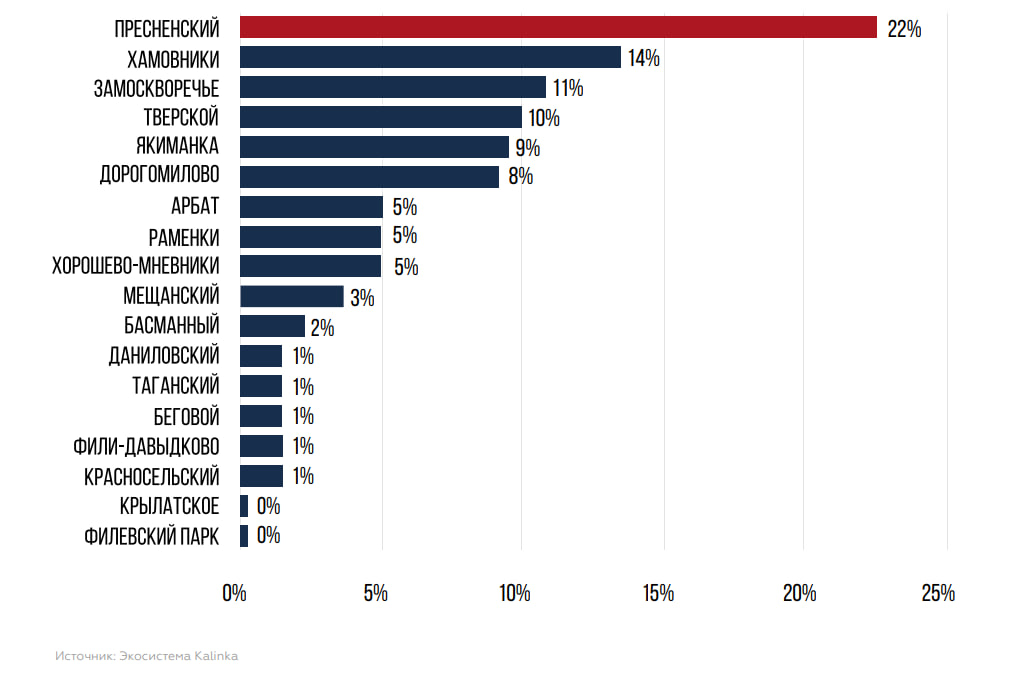
In the supply structure, the main volume is traditionally represented in the Central Administrative District: the share of the Central Administrative District increased over the year from 70% to 75% of the total area due to the release of new projects during 2024. In general, the leading districts in the elite market in terms of supply are still Presnensky district - 22%, including the Moscow City Exhibition Center, and the maximum share is accounted for by projects such as Life Time from Sminex, Dom Dau from Sum of Elements Group, Tishinsky Boulevard from Sminex., the Oko Tower. Next, with a 14% share in the top districts of Khamovniki due to the projects Frunzenskaya Embankment, Luzhniki Collection, Le Dome, Allegoria Mosca and Dom XXII. The Zamoskvorechye district took the 3rd place, displacing the Yakimanka and Tverskaya districts, due to new projects - 11%, where the largest number of apartments are for sale in the Tatarskaya 35 residential complex from Donstroy, A.Residence, Mont Blanc from Gals, Sadovnicheskaya 69 from Balchug Estate. Tverskoy district is in 4th place (10%) due to the Nicole residential complex, Kamerger apartment complexes, Ilyinka 3/8, etc.
In terms of the number of lots on sale in Moscow as a whole, the projects are leading: the Life Time residential complex in the Presnensky district (7%), the deluxe Nicole class project in the Tversky district (6%), the Dom Dau residential complex in the Presnensky district (5%), Tatarskaya 35 (5%), the Tishinsky residential complex. boulevard (5%), Badaevsky residential complex in Dorogomilovo district (5%), Frunzenskaya Embankment luxury residential complex in Khamovniki district (4%), etc.
Chart. Distribution of the volume of the elite offer for sale by districts, %
Price situation
In the 1st quarter of 2025, the average prices of exhibits in the primary luxury housing market in Moscow continue to increase. Offer prices were actively increasing in almost all projects, which was due to both high demand and the expansion of sales tools (a variety of installment programs). The deluxe subclass continues to have a high impact on the weighted average price in the luxury market as a whole, both due to an increase in the share of the subclass in the total supply, and due to a steady increase in prices in the segment.
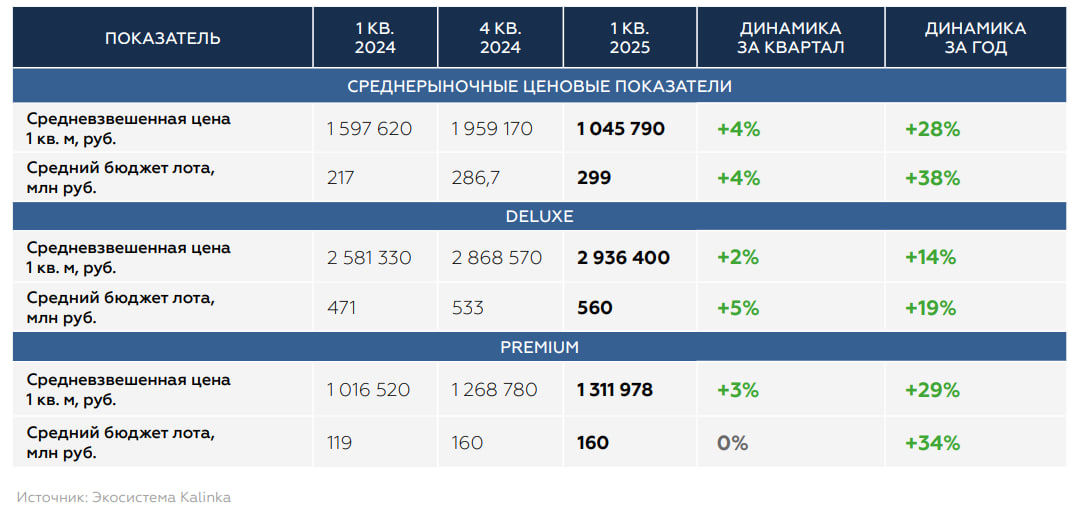
According to the results of the 1st quarter of 2025, the weighted average price of an elite offer in the primary market reached a record high, amounting to 2,045 thousand rubles / sq. m, which is 28% higher than in the 1st quarter of 2024. The growth was 4% in the quarter. The weighted average cost of 1 sq. m of luxury real estate in dollars was about $23.8 thousand, which is 37% higher than a year earlier.
Chart. The dynamics of supply (units) and the weighted average price (thousand rubles/sq. m.) in Moscow as a whole
Weighted average offer price by subclass:
deluxe
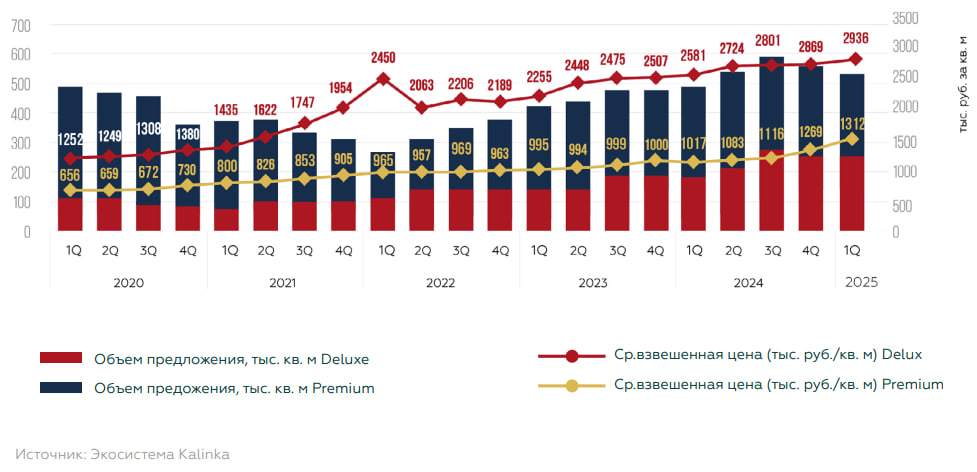
- In the deluxe segment, the weighted average price reached 2,936 thousand rubles/sq. m, an increase of 2% over the quarter and 14% over the year. The high price level is maintained due to the increase in prices in new projects under construction against the background of continued demand due to the active use of installment payment programs.
- The share of lots in the deluxe subclass displayed in foreign currency is 5%. Against the background of exchange rate volatility, the dollar value in the subclass was $34.1 thousand/sq. m, an increase of 21% over the year.
premium
- A steady increase in the weighted average price was observed in the premium segment, where the indicator increased by 29% over the year to 1,312 thousand rubles / sq. m. During the quarter, the growth was 3%.
- In the premium segment, the offer is mainly in rubles (97%). In terms of dollars, the annual average increased by 38% to $15.2 thousand/sq. m.
Table. Summary price indicators of supply in the primary luxury housing market in Moscow
Developers adhere to the object pricing plan and moderately increase prices in projects as part of an increase in their construction readiness and an increase in the share of installment sales (the installment cost may be partially offset in the total lot value).
For 70% of the complexes on sale, prices in the 1st quarter did not undergo major changes, and the dynamics of the weighted average price in projects depends on structural changes in the sale.
In 30% of the complexes, the weighted average price continued to increase over the quarter due to higher prices as construction readiness increased.
The average cost of an elite lot on sale was 299 million rubles, an increase of 38% over the year, due to structural changes in the supply and an increase in the share of supply and prices in the deluxe class, where the average cost was 560 million rubles (+19% over the year).
Chart. The dynamics of supply (units) and the weighted average price (thousand rubles/sq. m.) in Moscow by class
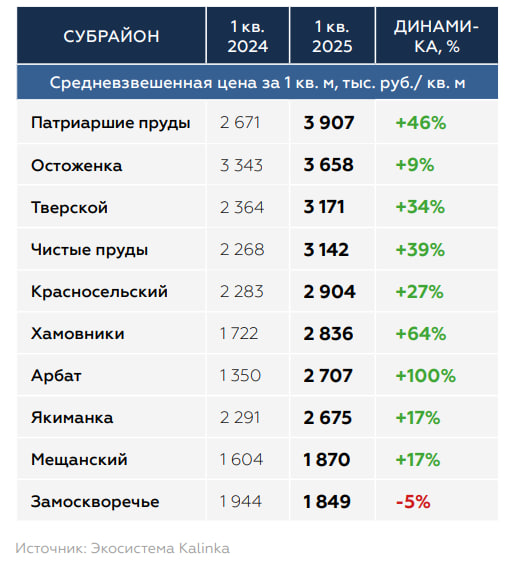
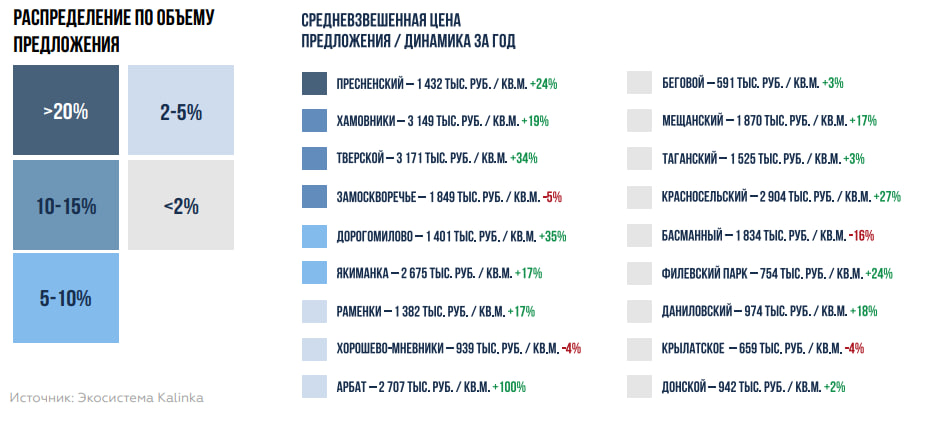
Against the background of an active increase in prices following the results of the 1st quarter of 2025, the highest weighted average cost among Moscow's subdistricts is observed in the location of Patriarchal Ponds - 3,907 thousand rubles / sq. m (Levenson, The Patrick's). Over the year, the rate in the location increased by 46%. The former leader of the rating, Ostozhenka–Prechistenka, is in second place - 3,658 thousand rubles per square meter (due to the projects Le Dome, Carre Blanc, Imperium, Obydenskiy No. 1 clubhouse), where growth over the year amounted to 9%. Tverskoy district closes the top 3, where the price exceeded 3 million rubles / sq. m. - 3,171 thousand rubles / sq. m. m (due to the Nicole residential complex, Ilinka 3/8 apartment complexes, Bolshaya Dmitrovka 9, the indicator increased by 34% over the year).
Among the districts as a whole, over the past year, the largest increase in the weighted average offer price occurred in the Arbat district, where the price reached 2,707 thousand rubles / sq. m (+100% per year) due to the release of new deluxe class projects (in 2024, sales of the Nikitsky 6 residential complex and apartments in the Cosmos Selection hotel complex started (apartments are in the process of being converted to apartments)). Dorogomilovo is in 2nd place with 1,401 thousand rubles / sq. m (+35%), due to rising prices in the Badaevsky residential complex and in the new Vesper Kutuzovsky project.
Table. Top 10 subdistricts by weighted average price per 1 sq. m.
In the premium class, the most expensive prices are in the Krasnoselsky district (Turgenev residential complex) - 2,904 thousand rubles /sq. m (+27% per year), in Khamovniki – 2,266 thousand rubles / sq. m (+82% per year) and in the Meshchansky district – 1,837 thousand rubles / sq. m. m (+25% per year). The largest increase in weighted average prices by district occurred in Khamovniki (+82%), Zamoskvorechye (+60%), Dorogomilovo (+35%), Tverskoy district (+35%), Arbat district (+31%).
In the deluxe class, the most expensive prices are in Presnensky district (Levinson, Brusov, etc.) – 3,618 thousand rubles/ sq. m. (+17% per year), as well as in Khamovniki, where the weighted average is 3,352 thousand rubles /sq. m. (+7% per year), and in Tverskoy district – 3,222 thousand rubles /sq. m (+24%). The largest increase in weighted average prices by region was observed in the Arbat district (+71%), in the Tverskoy district (+24%), and in the Presnensky district as a whole (+17%).
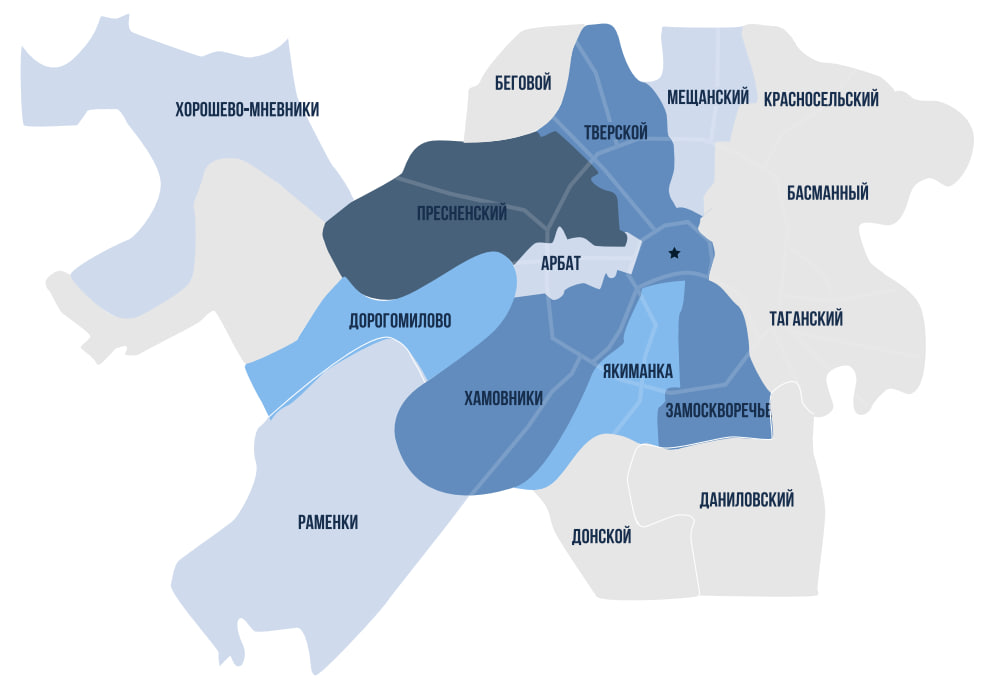
Map. Distribution of elite supply and weighted average prices in the primary luxury housing market by districts of Moscow
Demand
In the primary luxury real estate market in Moscow, demand remained at a high level throughout 2024, with the highest market activity traditionally recorded in the 4th quarter. In the 1st quarter of 2025, despite the traditional decrease in buyer activity at the beginning of the year compared to the end of the calendar year, there is still high demand for luxury real estate.
Buyers still sought to save capital or invest in an understandable and high-quality product. Installment programs with a down payment of 30% or more, and in some projects from 20% without increasing the cost, are available on the market, which allows buyers to choose the most interesting entry conditions for themselves. Installment and deluxe class programs are in high demand among buyers due to the opportunity to enter the project at a minimum cost due to a low initial payment and increase funds while maintaining a high key rate.
In the primary luxury housing market in Moscow, including projects outside the Central Administrative District and on the territory of the Moscow City MIBC, in the 1st quarter of 2025, demand remained at a high level in the primary luxury real estate market in Moscow throughout 2024, with the greatest market activity traditionally recorded in the 4th quarter. In the 1st quarter of 2025, despite the traditional decrease in buyer activity at the beginning of the year compared to the end of the calendar year, high demand for luxury real estate remained, 584 transactions were concluded, which is 73% higher than in the 1st quarter of 2024, but is expected to be 26% less than in the 4th quarter of 2024. The total area of lots purchased during the quarter was 69.8 thousand square meters, which is 75% higher than in the 1st quarter of 2024 and 22% less than in the 4th quarter of 2024.
• In the deluxe class, the number of transactions increased by 65% compared to the 1st quarter of 2024, to 99 transactions. However, this is 38% lower than the record figure for the 4th quarter of 2024.
• Premium Class showed a 74% increase in transactions compared to the 1st quarter of 2024, to 485 transactions per quarter. The figure is 23% lower compared to the 4th quarter of 2024.
Chart. Dynamics of the number of transactions (units) and weighted average unit prices of transactions (thousand rubles/sq. m.) in the elite market of Moscow as a whole
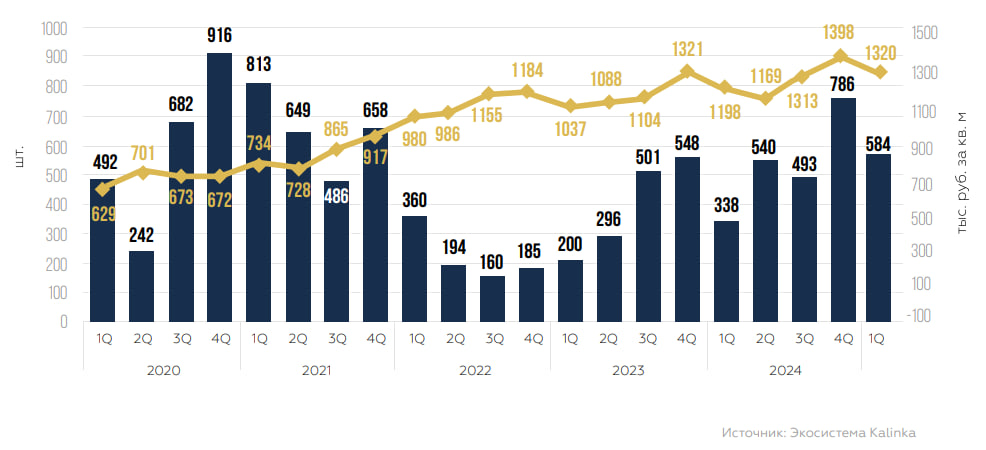
Table. Summary indicators of transactions in the primary luxury housing market in Moscow
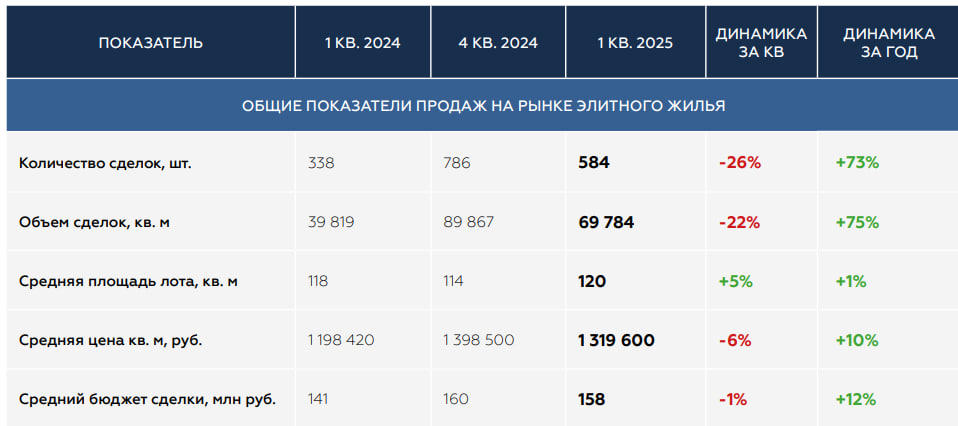
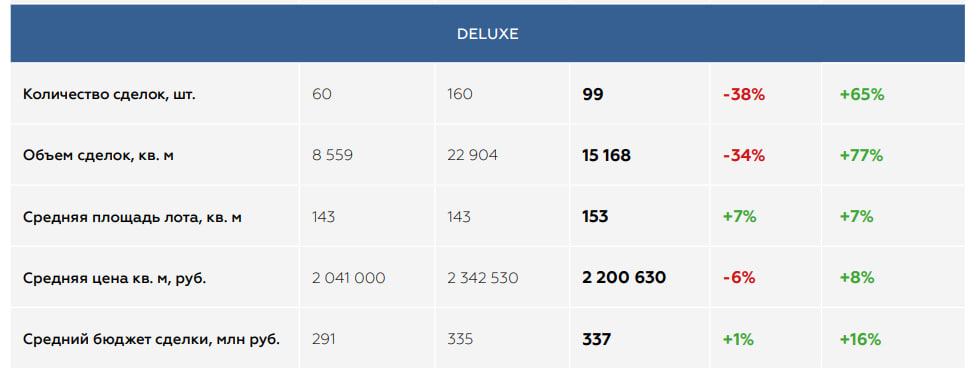
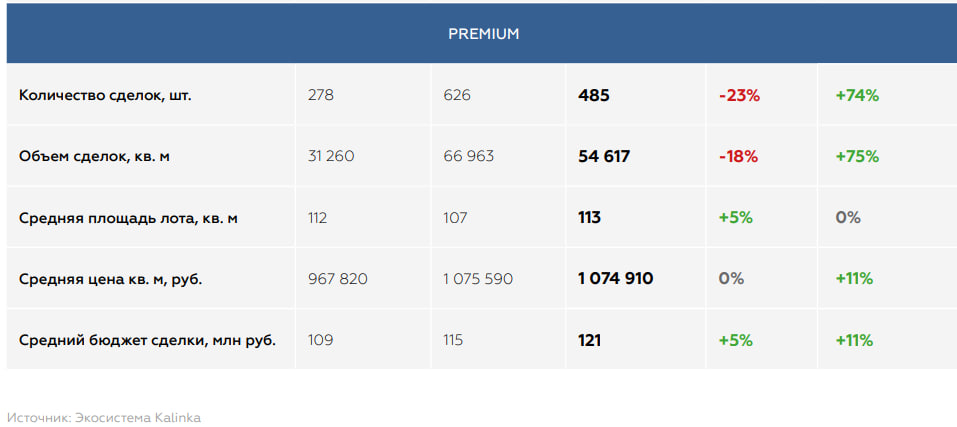
Chart. Dynamics of the number of transactions (units) and weighted average unit prices of transactions (thousand rubles/sq. m.) by subclasses in Moscow
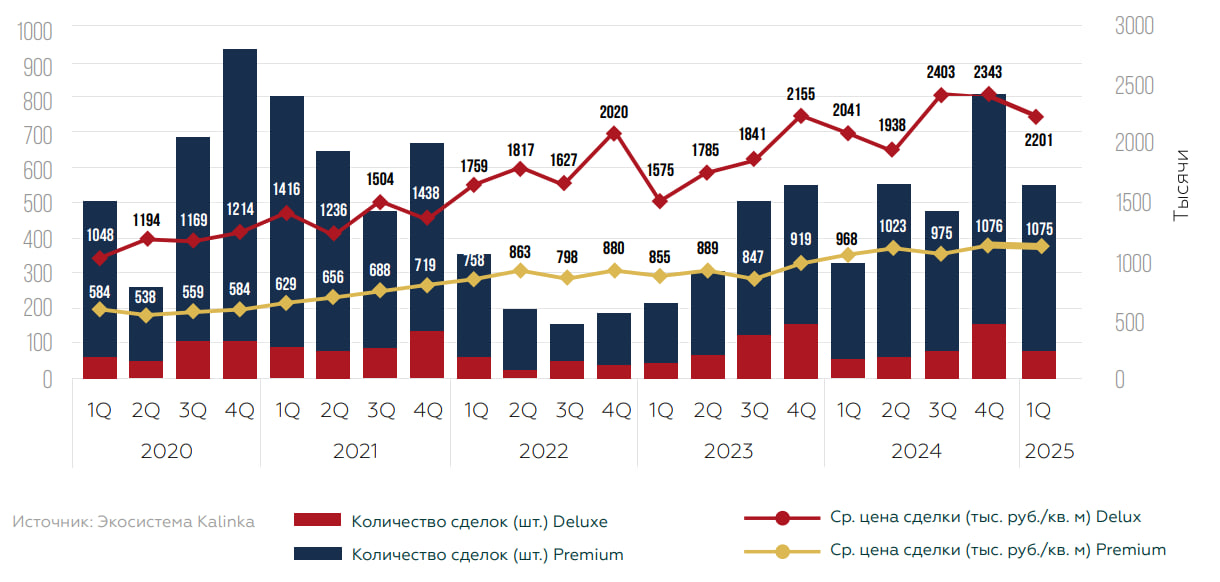
The majority of transactions in the 1st quarter of 2025 were traditionally concluded in the premium class - 83%, as well as 82% in the 1st quarter of 2024, the share of transactions in the deluxe class was 17%. The number of installment transactions exceeded 80%.
Traditionally, apartments were in the highest demand, accounting for 85%, while apartments accounted for 15%. The share of apartments in the deluxe class is 83%, in the premium class – 86%. Over the past year, there has been a decrease in the share of apartment sales in total demand from 17% to 15%. Against the background of an increase in the number of transactions per year compared to the 1st quarter of 2024, the number of apartment transactions in absolute terms increased by 44% per year to 85 lots per quarter.
Chart. Distribution of the number of transactions (units) by lot type in the elite market in Moscow, %

The average area of the lot in demand in the 1st quarter of 2025 was 119.5 square meters, compared to the 4th quarter of 2024, the figure increased by 5%, which was due to the dynamics in the deluxe class.:
- In the premium class, the average area of the purchased lot was 112.6 square meters, an increase of 5 compared to the indicator of the 4th quarter of 2024.%;
- In the deluxe class, the average area of the purchased lot was 153.2 sq. m. Compared to the 4th quarter of 2024, the indicator increased by 7%.
Against the background of rising prices in projects, the weighted average cost per 1 sq. m of the purchased lot increased significantly – to an average of 1.3 million rubles in the 1st quarter of 2025, which is 10% higher than in the 1st quarter of 2024. Compared to the figure for the 4th quarter of 2024, there was a decrease of 6%, due to the high purchase budget at the end of the year.
- In the premium segment, the weighted average purchase price increased to 1,075 thousand rubles/sq. m (+11% compared to the 1st quarter of 2024);
- In the deluxe segment, an increase of 8% compared to the 1st quarter of 2024 to 2.2 million rubles/sq. m.
The average budget of the transaction in the 1st quarter of 2025 was about 158 million rubles, which is 12% higher than in the 1st quarter of 2024.:
- In the premium segment, the average budget increased to 121 million rubles (+11% compared to the 1st quarter of 2024);
- In the deluxe segment – 337 million rubles (+16% compared to the 1st quarter of 2024).
The main demand in the 1st quarter of 2025 was for projects located outside the Central Administrative District - 51% of transactions. This was due to the launch of sales of new projects and queues in existing premium–class projects. During the year, the share of transactions in the zone increased significantly from 39% in the 1st quarter of 2024 to 51% in the 1st quarter of 2025. The number of transactions per quarter in the zone under review was more than 300, which is 130% more than in the 1st quarter of 2024. The total amount of space acquired during the quarter Among the enlarged zones in the 2nd place is projects in the Central Administrative District - 48% of the zone's share in the demand structure. 280 transactions were concluded in the CAO in the 1st quarter, which is 37% higher than in the 1st quarter of 2024, but also 37% lower than in the 4th quarter in the zone under review, amounting to 34 thousand square meters (+118% compared to the 1st quarter of 2024), the weighted average transaction price is 877 thousand rubles per square meter (-4% compared to the 1st quarter of 2024).The sales rate of premium lots in the territory of the Moscow City Exhibition and Exhibition Center remains at a minimum level: the share of the zone has decreased and is less than 1%. The decrease in the share of transactions in the area is due to a reduction in the remaining supply in skyscrapers and the lack of a new supply in the location.
Chart. Distribution of transaction volume by the enlarged zones of Moscow, sq. m in %
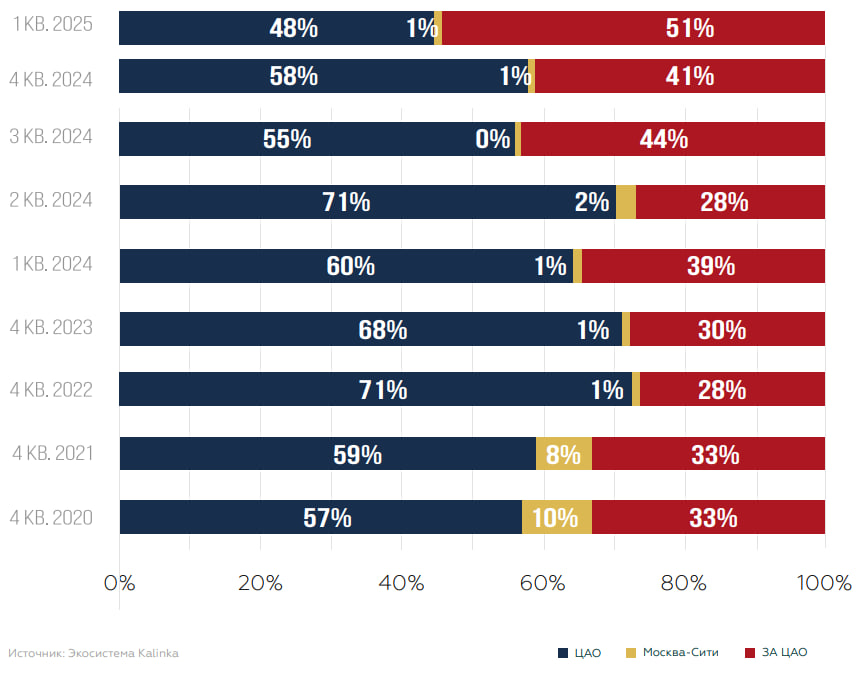
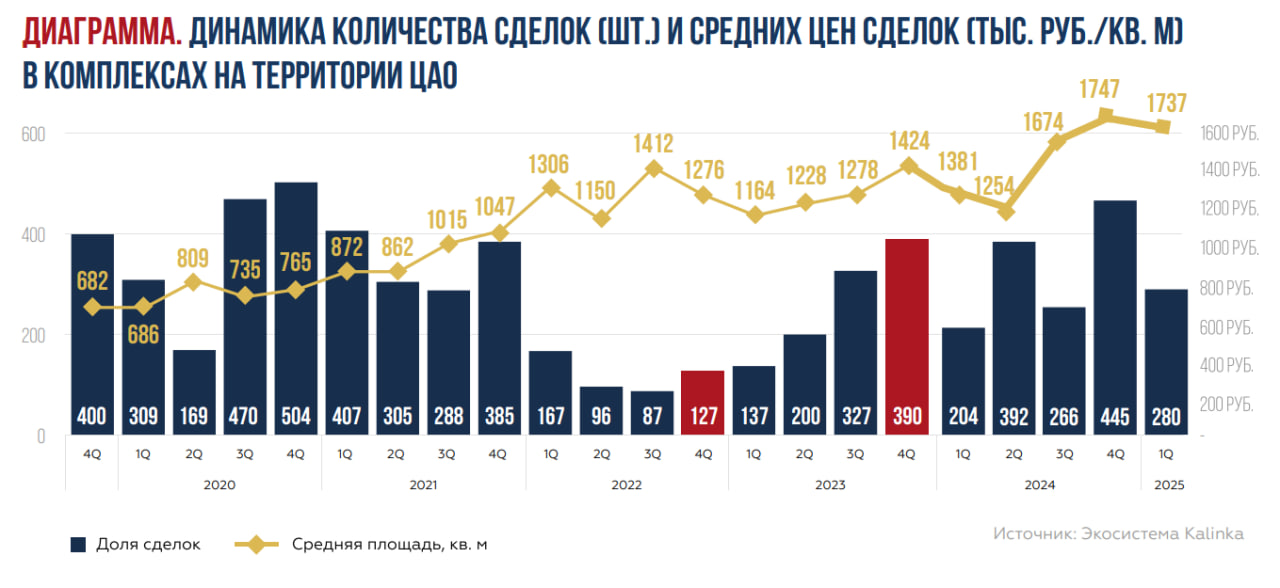
Among the enlarged zones, projects in the Central Administrative District are in 2nd place - the zone's share in the demand structure is 48%. 280 transactions were concluded in the CAO in the 1st quarter, which is 37% higher than in the 1st quarter of 2024, but also 37% lower than in the 4th quarter in the zone under review, amounting to 34 thousand square meters (+118% compared to the 1st quarter of 2024), the weighted average transaction price is 877 thousand rubles per square meter (-4% compared to the 1st quarter of 2024).The sales rate of premium lots in the territory of the Moscow City Exhibition and Exhibition Center remains at a minimum level: the share of the zone has decreased and is less than 1%. The decrease in the share of transactions in the area is due to a reduction in the remaining supply in skyscrapers and the lack of a new supply in the location. In 2024. The total area of lots purchased in the Central Administrative District was 36.0 thousand square meters (+50% compared to the 1st quarter of 2024), and the weighted average transaction price was 1.7 million rubles per square meter (+26% compared to the 1st quarter of 2024).
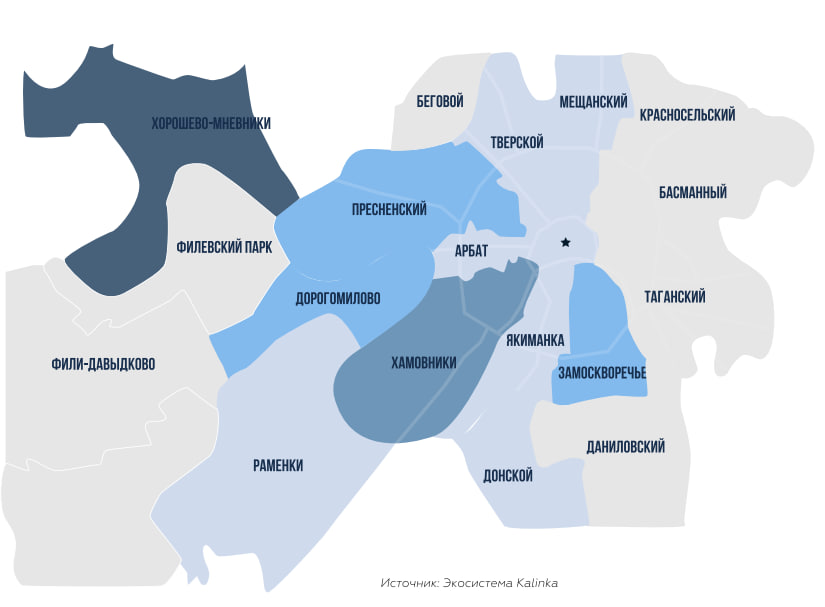
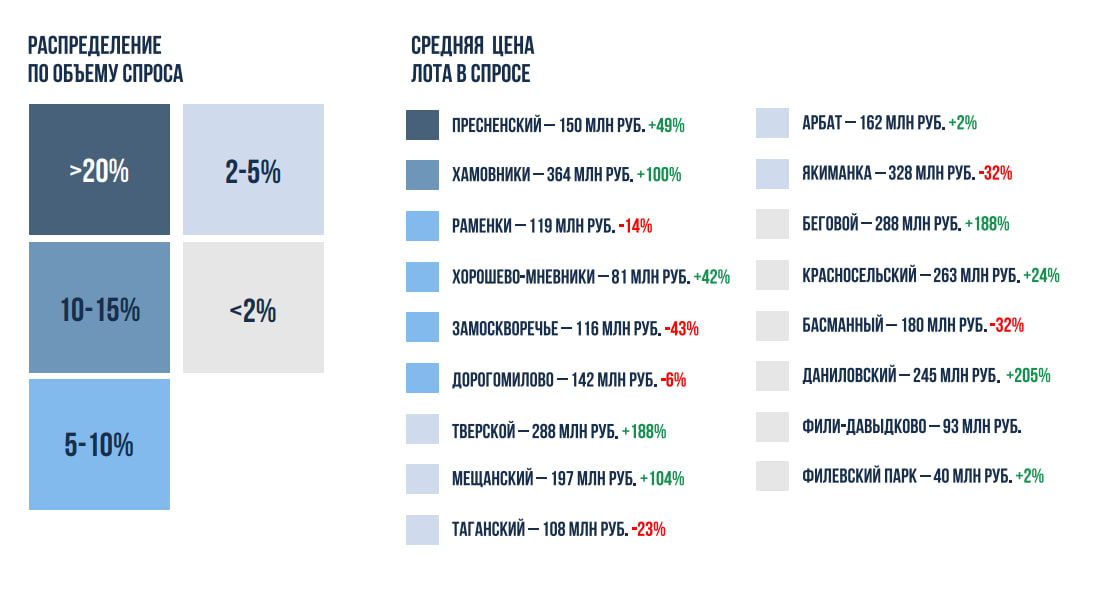
In the 1st quarter of 2025, Khoroshevo-Mnevniki district rose to 1st place in the rating in terms of the territorial structure of sales by district - 21% per quarter. m and 21% in terms of the number of lots due to the sale of lots in the Ostrov project from Donstroy. Khamovniki is in 2nd place with a share of 14% in the square. m and 11% in terms of the number of transactions due to sales in the Luzhniki Collection from Absolute Premium, DOM XXII from Donstroy, Frunzenskaya Embankment from Smirex, Khamovniki 12 from Coldy. Presnensky district moved to the 3rd place with a share of 14% of the square meters sold in Moscow and a share of 14% of the total number of lots sold. The district took a leading position in the rating due to apartment sales in the residential complex Life Time, the residential complex Tishinsky Boulevard, the residential complex Dom Dau, the Lucky residential complex, as well as in the Sky View apartment complex.
- In the premium class, Khoroshevo- Mnevniki accounted for the largest number of sales over the year–25% of transactions due to sales of premium apartments in the residential complex Ostrov, the weighted average transaction price reached 689 thousand rubles / sq. m. Presnensky district took the 2nd place - 14% with an average sales price of about 1,168 thousand rubles. rub / sq . m. Further Dorogomilovo-15% and 1.2 million rubles / sq. m. m and Khamovniki – 8% and 2.2 million rubles / sq. m.
- In the deluxe class, the largest number of transactions occurred in the Khamovniki district – 33% of transactions, and the weighted average sales price was 2.3 million rubles / sq. m, followed by the Tverskoy district – 25% and 2.6 million rubles / sq. m. m and Yakimanka-13% and 1.9 million rubles / sq. m.
In the 1st quarter of 2025, the largest number of deals were concluded for projects under construction: new premium lines in the residential complex Ostrov from Donstroy (21%), Badaevsky from Capital Group (7%), Shift from Pioneer (5%), Luzhniki Collection (5%) in Khamovniki from Absolute Premium, Life Time residential complex (5%) in Presnensky district from Sminex. The most sold projects in the 1st quarter were:
- In the premium class: Residential complex "Island" from Donstroy (25%), residential complex "Badaevsky" (9%) in Dorogomilovo from Capital Group, Shift in Donskoy district from Pioneer (6%), Luzhniki Collection (6%) in Khamovniki from Absolute Premium, LCD Life Time from Sminex (5%). In each of these projects, more than 20 deals were completed per quarter.
- The most popular projects in the deluxe class are DOM XXII from Donstroy in Khamovniki (17%), Nicole in the Tverskoy district from MR Private (15%), Dom Frank from Transstroyinvest in the Meshchansky district (14%). Each of the projects sold more than 10 lots per quarter.
Map. Distribution of the volume of sold areas and average budgets for the purchase of sold lots by districts of Moscow, 1st quarter of 2025
Similar articles
Broker help
We will help you find, buy or sell real estate

